Creating and Modifying Tables
Creating and Modifying Tables in the CMS Editor
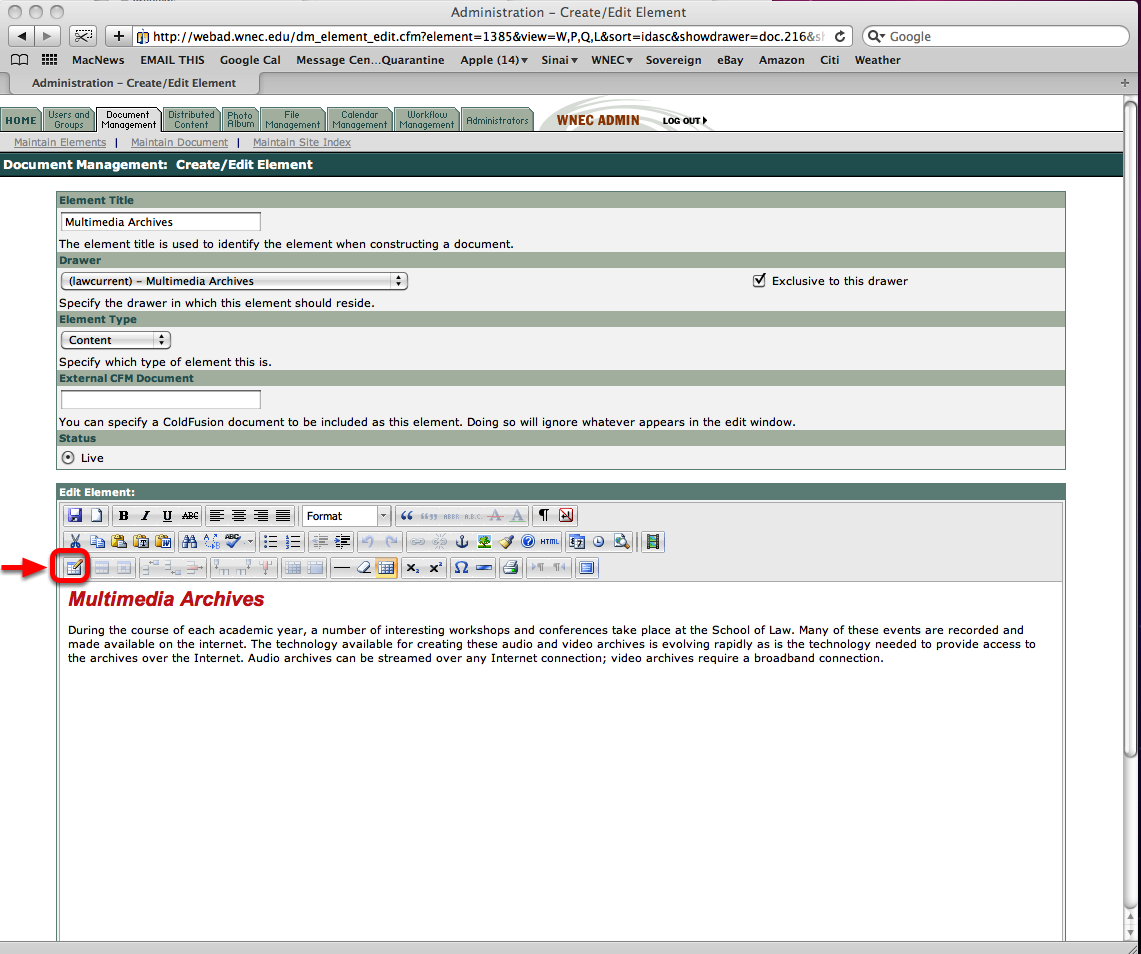
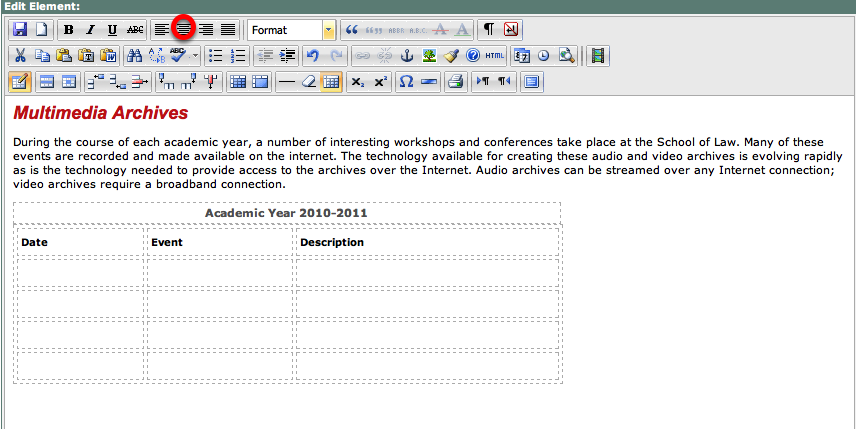
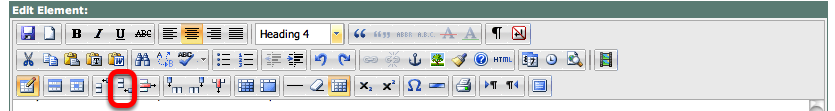
Creating a Table - We will start with a page with a title and a small paragraph. Let's assume, then that you wish to present information that requires being set out in columns and rows (like a spreadsheet). Creating tables requires a little effort, but there is a lot of help available from within the editor. The picture above is the page into which we will insert a table. The icons which we will use are on the third row of the toolbar. The red arrow is pointing to that row. The first icon, circled in red, is the icon which we will use to create the table. Click on that icon.
The "Insert/Modify table" Window
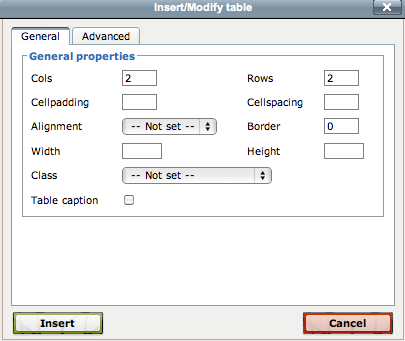
The new window that is pictured above will now appear on your monitor - in the grey bar at the top you can see that it is called "Insert/Modify table." It asks us how many columns ("Cols") we want our table to have and how many Rows. As you know, the columns run up and down and the rows run across. If you are not certain how many columns or rows you will need, just make your best guess. You will be able to add or delete columns and add or delete rows as they turn out to be needed. But your work will go most quickly if you take the time to count the columns and rows on the document from which you are working before you begin.
You are also asked whether you want any "Cellpadding" or "Cellspacing." Cellpadding specifies the amount of space (in pixels) between the sides of an individual cell and its contents. Cellspacing sets the amount of space between the cells. (The term "cell" means an individual rectangle within the table.) If I am not using borders, I usually set both at 3; if I am using borders, I usually set both at 6. This is a question of appearance and you will be able to make a judgment about that after you have finished creating the table and look at it in Preview. If you need more or less padding or spacing, you can go back to this first icon and modify the number you choose in this window pictured above.
For now, you will probably want to leave the Alignment setting at its default (--Not set--). In a later step in this lesson, we will see how and when you can change the alignment of text.
On the WNEC website, most tables are presented without borders, but there are times when clarity is enhanced by using borders in your tables. If you decide, after you look at the table you have created, that it would be easier to read if it had borders, you can return to this window and enter a number in the cell next to the word Border. Seldom will you enter any number other than "0" (no border) or "1" (thin black lines defining all of the cells of the table and framing the table itself).
The Width and Height give you the opportunity to set the total size of the table. I suggest leaving blank the Height entry - generally you will not be able to determine what that height will be. It will be easier to work with the Table, however, if you set the width at a number approaching the available width of the screen - so let's set it at 500 - again, that can be modified later.
If you want your table to have titles for each row, click the box next to the title "Table caption" and select, in the dropdown menu next to "Class" the style of the title of the Table.
Sample Entry for "Insert/Modify table" Window
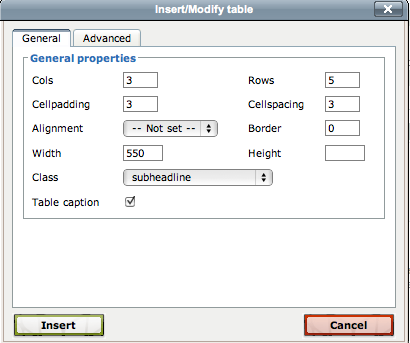
This is what your Insert/Modify table will look like if you used the settings suggested in the prior step. Now we are ready to create the table described in these settings - to do so, click the word "Insert" at the bottom left corner of the Insert/Modify table.
The Table in the WYSIWYG Window
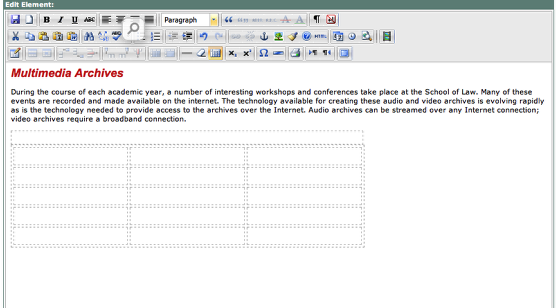
Thie is the table you just created. Notice that the lines describing the colums and rows are dotted - that is because you elected not to have borders. If you had entered "1" in the Insert/Modify table, the lines would be solid rather than dotted. The table has 3 columns and 5 rows of cells and one row that is a single cell at the top because you clicked the "Table caption" box in the Insert/Modify table. Now some data can be entered into the table. We will begin by adding a Caption in the Caption row and then, in the next row which has 3 individual cells, we will enter titles for the columns. Your table may not need titles for the columns. If it doesn't you can ignore this step. But for any data you enter, do not be surprised when the column width changes as you enter the data. Simply place your cursor in the cell into which you wish to enter text and the column width will automatically readjust. You can move horizontally from cell to cell by using your keyboard's arrow keys.
Titles for Each Column
Here we have created titles for each column. It would probably be better if they were centered. So use your cursor and mouse to drag across the row with the titles. When all are highlighted, press the icon for centering circled in red in the above picture. If you have highlighted the line of column titles and pressed the icon circled in red, your document will look like this next screen shot.
Column Titles Centered and Re-Styled
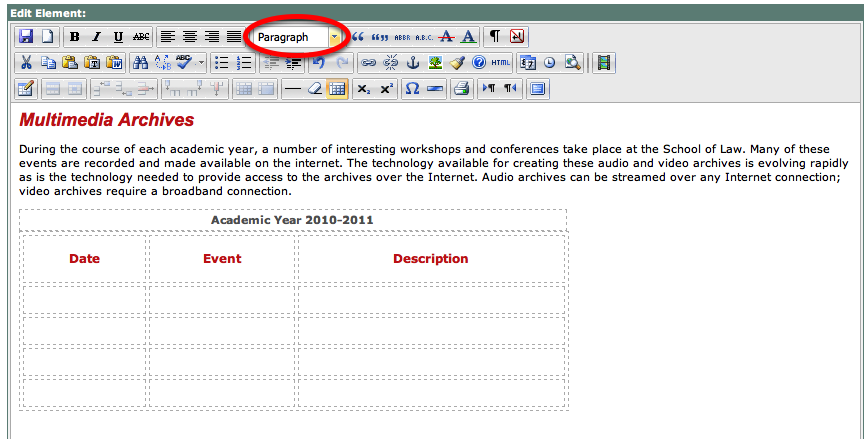
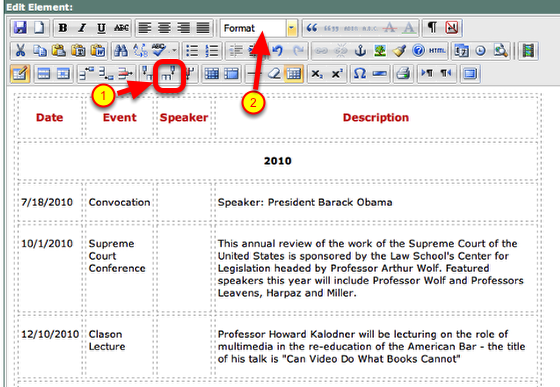
Now that the column titles are centered, they should probably be restyled so that they are differentiated from the table data that we will place in the remainder of our table. To do so - making certain that the column titles are still highlighted, click on the drop down menu which has the word "Format" (or it could be "Paragraph" as circled above) and select headline 4. (This choice is a bit arbitrary. You could, for example, have selected headline 6 for the column titles if you prefer they be in black rather than the red of headline 4).
Entering and Styling the Table Data
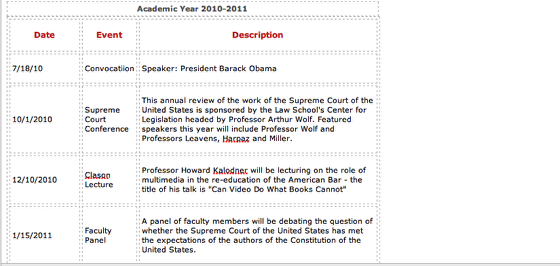
You ar ready to enter data, which may look something like the following screen shot. The data I have entered is, of course, purely fictional. After I entered the data, I changed the print style by dragging my cursor over all of the newly entered text and then selecting "Paragraph" from the drop down style menu. This will transform the type in to the style generally used on the law school's web pages. You may find it easier to move from cell to cell within the table by using your arrow keys.
Alignment
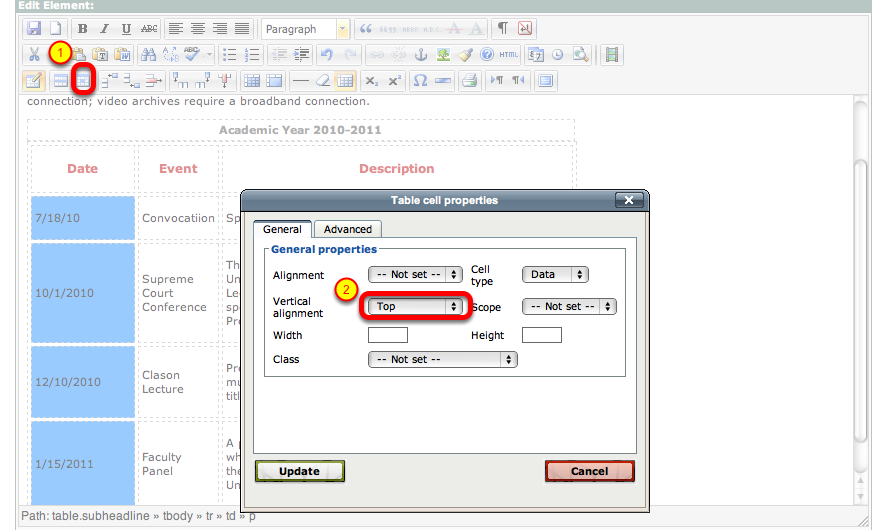
You may be comfortable with the table - but I am troubled by how it looks when I use Preview to use it. The problem is that the date is in the vertical middle of the cell and so is all of the other data. I want to see how my table would look like if the date were at the top of each cell rather than the middle of the cell. To do this, I select an icon from the editor that we have not yet used. I drag through the date cells (now highlighted in blue), (step 1) select the icon circled in red to reveal the window entitled "Table cell properties) and (step 2) in that window I go to Vertical alignment (also circled in red) and select "Top." Then press the word "Update" in the lower left hand corner of the Table cell properties window.
Align All of the Cells to Top
I rather like the notion of each cell beginning at the top of the cell rather than being centered on the other text in the row. I could use the same technique for the other two colums as we used for the date column but there is a quicker way. I can drag my cursor over all of the cells in the table (other than the row of titles for our columns) and then select Table cell properties (see prior step) and choose Vertical alignment "Top." Then my table will look like the screen shot above. Of course you could choose to align any individual cell or all cells centered (as they are by default) or at the bottom. My experience is that where there are an even number of lines in all the cells of the table, the default of middle works best, but where there are uneven lines in rows, as in the example above, aligning all cells to top works best.
Reviewing Table With Preview
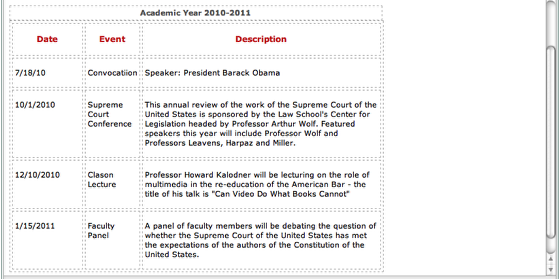
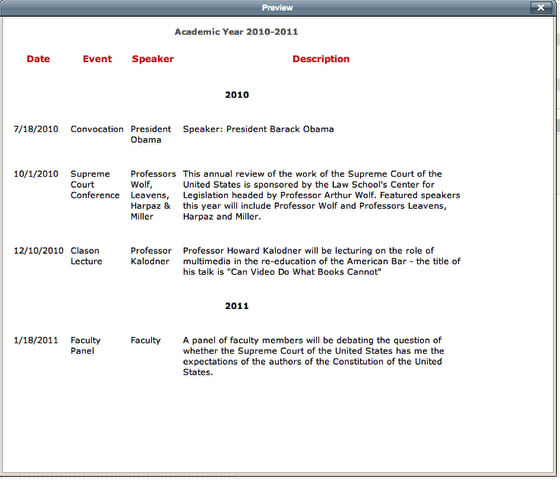
Now it is time to take a look at our work to see what, if any, revisions we wish to make. So I select "Preview Element" at the bottom left corner of the editing window and the above image is what I see. It looks fine, but I realize that there is an event in November which I failed to enter. I close the Preview screen and I make use of the editor to add a new row between the 10/1/2010 row and the 12/10/2010 row.
Adding a Row
To add a row, I need to select the icon in the editor which, when I pass my cursor over it, will let me "insert row after" or its companion icon which lets me "insert row after." To make these icons active, I must place my cursor anywhere inside the table. Since I have decided to add a row after the 12/10/2010 row, I place my cursor in the cell which reads "12/10/2010" and then I select the icon circled above which is the "insert row after" button. (The "insert row before" is just to the left of this button) As soon as I select it with my cursor, a new row is created after the 12/10/2010 row and before the 1/15/2010 row as shown in the next picture.
Adding a Column
Here is the table with a row added in the desired place and it is ready for data entry. But suppose, in addition, the person requesting the creation of the table decides that there should be a new column with the Speaker's name in that column. Can I do that without creating the table all over again? Fortunately, yes I can. Suppose the new column should be after the "Event" column but before the Description column. I place my cursor in any cell in the Event column and select the icon that tells me when I pass my cursor over it that it is the "insert column after" button. It is circled in red above and, when selected, will create a new column in the desired location. The icon just to the left of this icon would be used to "insert column before." The column is narrow, but enter data into it and it will widen. You can then type in the column title, Speaker, and select the format drop down "heading 4" to match the other column titles.
Removing a Row or a Column
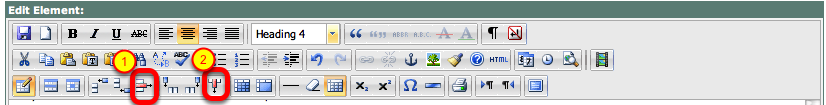
Sometimes we are asked to remove a row or a column. That, too, can be done easily with icons available to us in this same row of table icons. In the screen shot above, the (1) represents the icon used to remove a row, the (2) identifies the icon to be used when a column is to be removed. It is imporant that before you select either of these icons, your cursor must be in the row or in the column you wish to remove.
Revamping Table to Include Two Sections
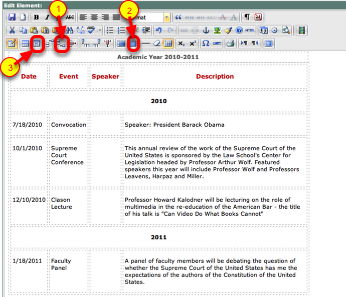
Now, if you are feeling confident about all that we have accomplished, let's undertake a more complicated effort, but one that we can still accomplish within the WYSISYG editor. The author of our table has decided that it would be better to separate 2010 events from 2011 events within the same table. This involves several steps, some less obvious than others. First let's create a row between the last 2010 event and the first 2011 event. Place your cursor in the 12/10/2010 cell and then click the icon which adds a row after this row. This is step 1 above. The icon just to the left of the insert row below is the insert row above icon and we could have used it if we placed our cursor in the 1/18/2011 cell. We now have a new row just where we want it, but it has 3 columns and we want a title row that will have only 1 column. To accomplish this, we highlight the entire row with our cursor and press the icon numbered 2 above. Pressing this icon merges all of the highlighted cells into a single cell. Now we can enter "2011" into this new row and press the centering button numbered 3 above.
Of course we now have to do something with the caption that reads Academic Year 2010-2011. We have a number of choices, but the easiest one would be to add still another row just before the 7/18/2010 row and enter 2010 into it and center it. That requires repeating the same steps we used to add the 2010 title row except that we will select the add a row above button just to the left of the add a row below button numbered 1 above.
Neither of these look like titles, however. So we need to highlight them, select the format "paragraph" and then press the B for bold key on the top row of icons. They still don't stand out quite enough to draw the attention of the viewer to the division into 2010 and 2011 events, so let's increase the height of these two title rows. To do that, select the row (by highlighting it with your cursor) and press the icon for cell formatting which is numbered 3 in the screen shot above. In the cell formatting window which then appears, enter 30 for the height (that is actually 30 px or pixels, but you only need to enter the number 30) and make sure the vertical alignment is Center. You will want to both of our new title rows.
The result of these steps can be seen in the picture of the screen above.
Our Table in Preview
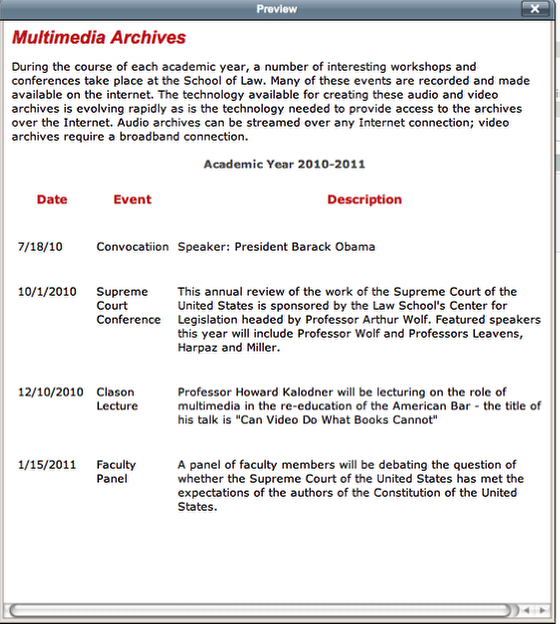
Congratulations - this is how our table looks in Preview Element.